Monitoring techniques
Path to observability
Context
Given the latest needs…🤔 trends…of architecting distributed solutions, which basically involves shifting from function calls to network call, traditional monitoring approaches often fall short. As a result two methodologies have emerged as leading approaches: Utilisation Saturation and Error (by Brendan Gregg) and later on Rate Errors Duration (by Tom Wilkie).
TL;DR
USE indicate the health of the infrastructure while RED being more app-specific can provide deeper insights into user satisfaction.
USE
From a high level perspective the following steps outline the process:
for each resource in ["CPU", "Memory", "Storage devices"...]:
  check utilization:
        avg time the resource was busy processing work
  check saturation:
        new work cannot be processed and therefore is queued
  check errors:
        count system error
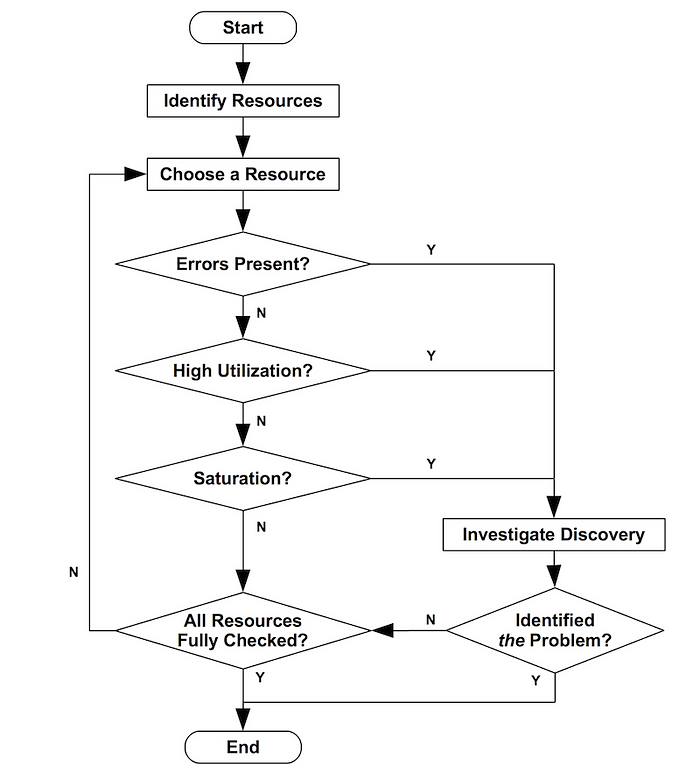
Next …the visualisation depicts the flow that one needs to go through for the desired resource:

Furthermore applying this technique for CPU by leveraging Prometheus metrics (e.g. Node metrics) would look like this:
CPU capacity (cores per node):
sum by (node) (kube_node_status_capacity{resource="cpu",unit="core"})
CPU utilisation (% per node)
100 - (avg by (instance) (rate(node_cpu_seconds_total{mode="idle"}[5m])) * 100)
CPU saturation (per node)
Typically referring to the degree of which the CPU is saturated and unable to process incoming task immediately (e.g. tasks waiting to execute because no CPU cycles are available).
#  1-minute load average per CPU core for each instance.
node_load1 / on(instance) group_left() count(node_cpu_seconds_total{mode="user"}) by (instance)
Concretely for an 8-core CPU, a load average of 8.0 means the system is fully utilised, while a load average above 8.0 indicates that processes are waiting for CPU time, suggesting potential saturation.

Utilisation and saturation are intertwined: if a CPU is busy processing tasks 70% of the time over a given period, its utilisation is 70% and if the CPU is constantly running at 100% utilisation and there are more tasks waiting to be processed, then the CPU is saturated.
It’s important to note that it is possible to have low CPU usage and still experience a saturated CPU, i.e. for a I/O-bound tasks, processes may spend significant time in a wait state, thus contributing to the load average despite low active CPU usage.
CPU errors
Prometheus does not directly expose “CPU error” metrics , but the context of Kubernetes one can infer CPU-related issues by monitoring aspects like throttling (processes/containers are limited from using CPU resources due to constraints like CPU quota/limits):
# throttling: CPU usage was restricted by the Completely Fair Scheduler
sum by (instance) (rate(container_cpu_cfs_throttled_periods_total{}[5m]))
CPU throttling is determined by your baseline, it’s essential to compare the current value with historical data,as asudden increase might indicate a problem.
RED
It’s all about requests: rate at which the system receives requests, how many of those requests are failing, and what is the length of time for each request.
The primary metric is http_requests_total. Focus on error by using thestatus label i.e. http_requests_total{status=~”5..”} and last but not least you can leverage histogram for the duration of HTTP requests, divided into buckets, i.e. the 95th percentile of the requests durationhistogram_quantile(0.95,sum(rate(http_request_duration_seconds_bucket[5m])) by (le)) .
Takeaway
Users don’t care how well your monitoring works; they care about how well your services are performing, and at the end of the day you can lose users simply because…“slow is the new down ” .😉
Sources:

